Maps and Visualizations
GERICS develops concepts and methods for simple, easily understandable visualizations of climate related data. Examples include projected precipitation changes, which have been visualized on a “rain map”. The maps being derived from comprehensive data bases like ensembles of local climate projections.
GERICS Climate Signal Maps
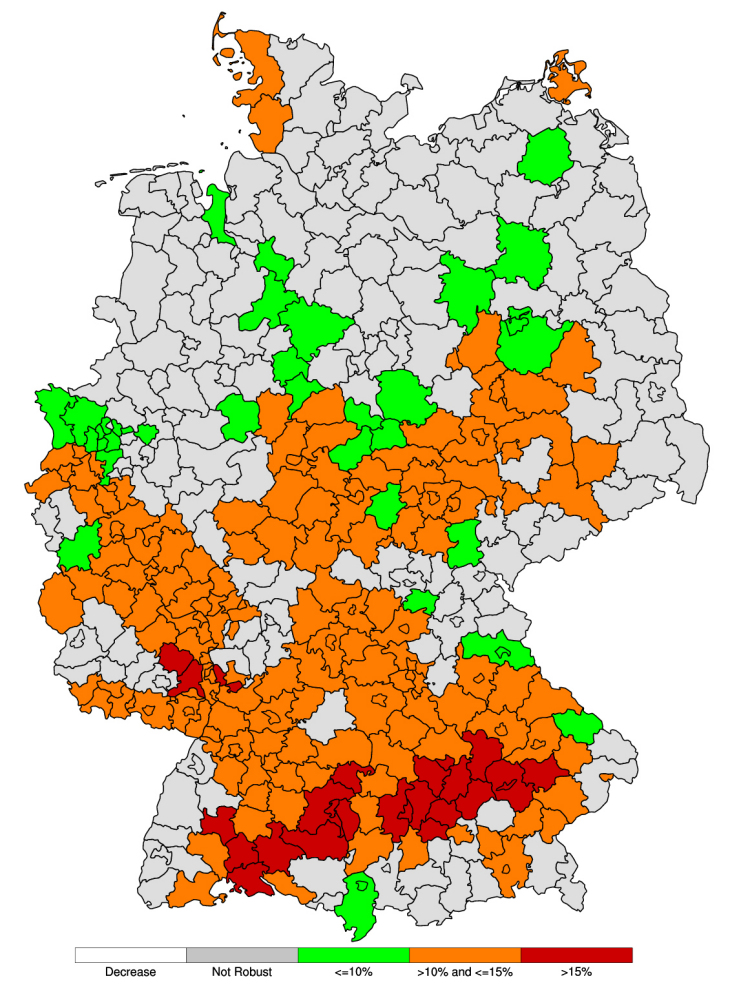
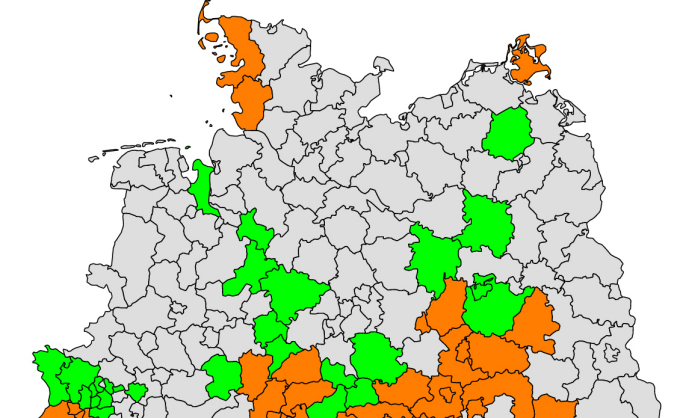
Which regions in Germany will show significant climate changes? And how robust are statements about expected climate changes? In order to give answers to questions such as these, GERICS has developed the Climate Signal Maps, with which it is possible to assess future regional climate change in Germany. The maps are based on regional climate change simulations. In order to estimate the range of possible future climate changes in particular regions, we used the largest available ensemble of high-resolution climate projections.
GERICS Climate Signal Maps regional
GERICS Climate Signal Maps (global)
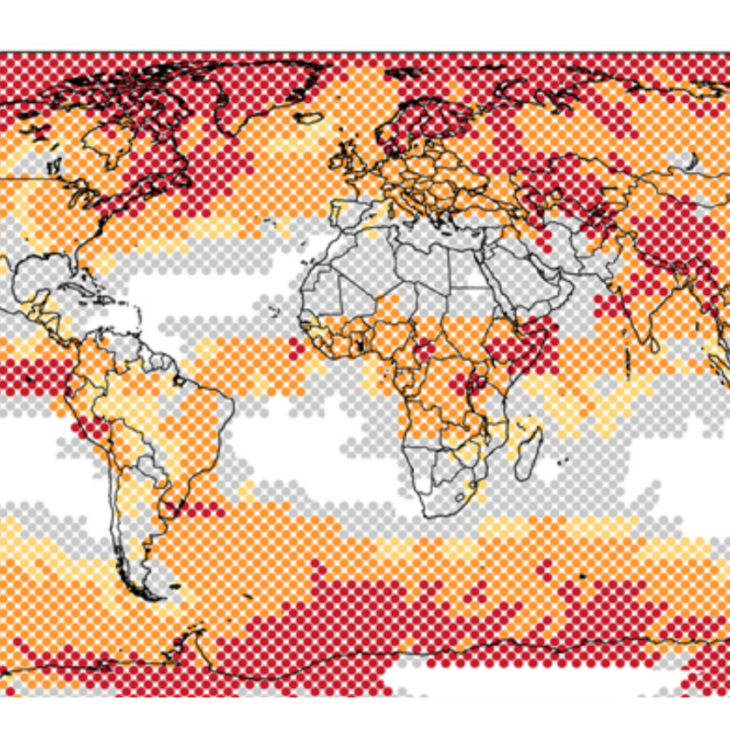
The global Climate Signal Maps are mapping the robustness of global climate change information. They are based on an ensemble of global climate projections.
GERICS Climate Signal Maps global
GERICS Rain Map
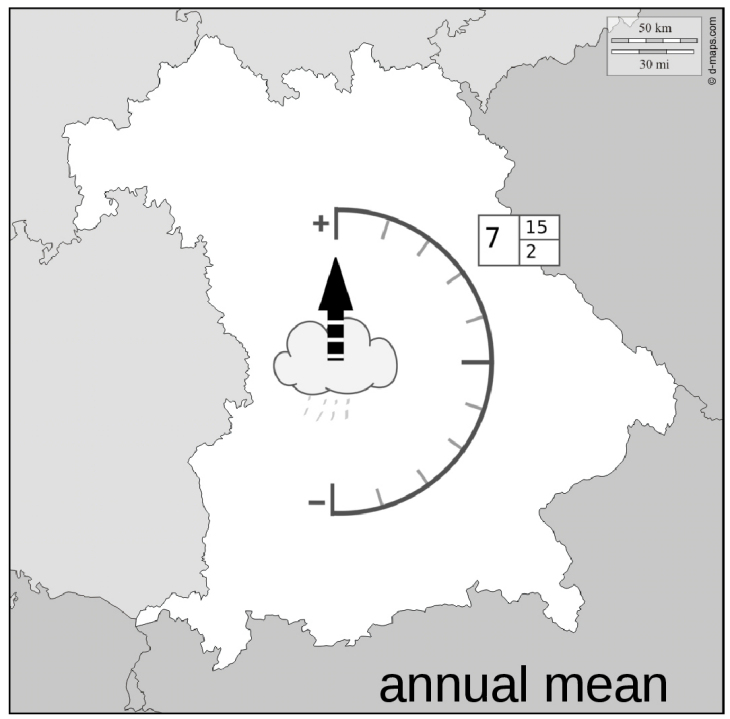
In cooperation with representatives of some of the German Bundesländer, GERICS has developed the Rain Map, a simple, easily understandable visualization of projected precipitation changes. The data base is an ensemble of regional climate projections (e.g. Euro-Cordex). The visualization method can be easily transferred to other climate parameters and regions.
further information
Videos and Animations
A compilation of examples of regional and local projections and visualizations.
further information
IMPACT2C web-atlas
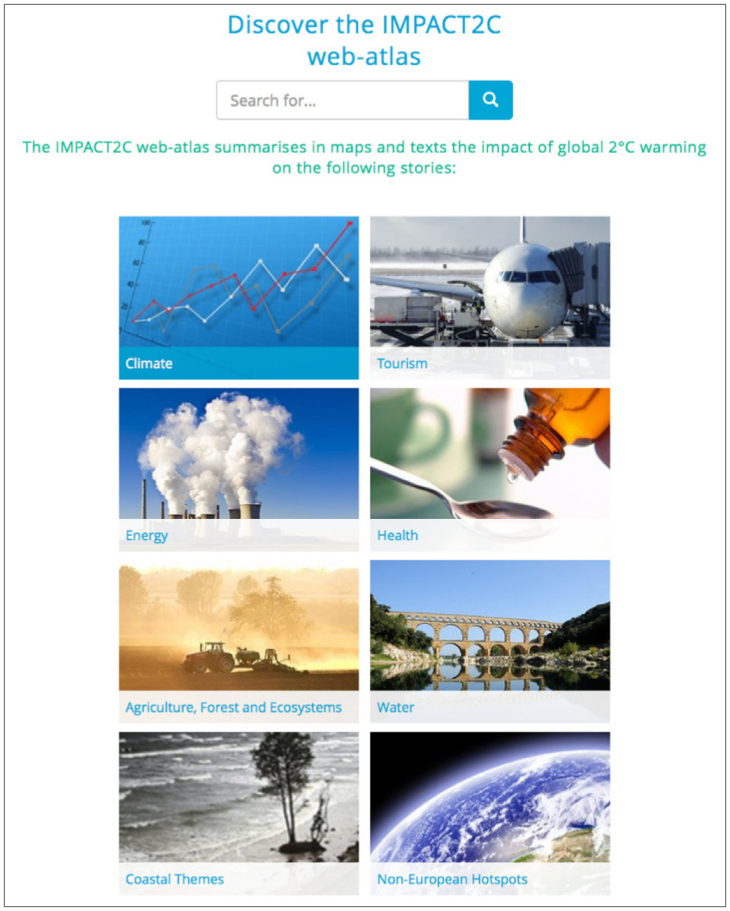
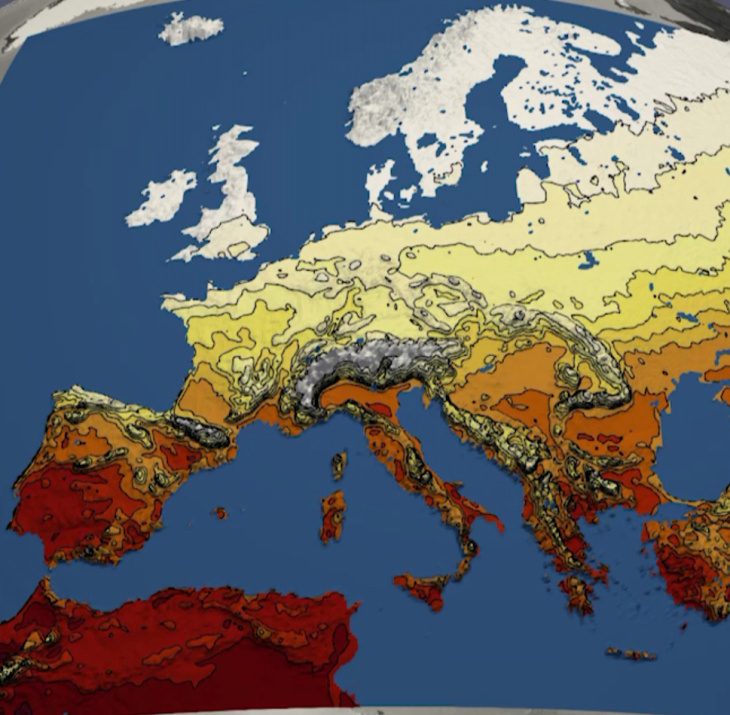
The interactive IMPACT2C web atlas shows what consequences a temperature increase of 2°C could have for Europe. It visualises the impacts on the climate, energy, health, agriculture, forestry, ecosystems, water, tourism and coastal sectors.
IMPACT2C web-atlas