Examples for thematic Climate Signal Maps
Taken from:
Pfeifer, S.; Bülow, K.; Gobiet, A.; Hänsler, A.; Mudelsee, M.; Otto, J.; Rechid, D.; Teichmann, C.; Jacob, D.: Robustness of Ensemble Climate Projections Analyzed with Climate Signal Maps: Seasonal and Extreme Precipitation for Germany. Atmosphere 2015, 6, 677-698, doi:10.3390/atmos6050677.Increase of winter precipitation (RCP4.5)
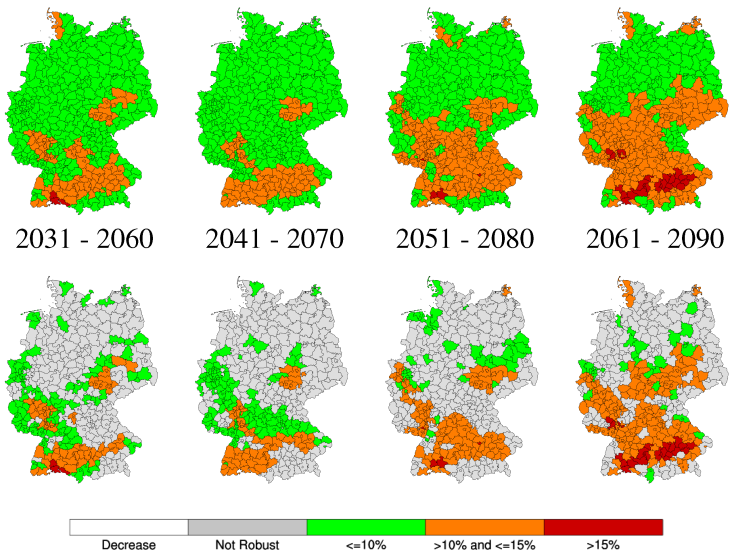
Figure 1. Increase of winter precipitation (%) for (from left to right) 2031–2060, 2041–2070, 2051–2080 and 2061–2090 compared to the reference period 1971–2000. Color coded: median of 10 RCM simulations from the EURO-CORDEX RCP4.5 simulations. For the top panels, no test was applied to the data. In the lower panels, regions that failed at least one of the two robustness tests are grayed out.
Increase of winter precipitation (RCP8.5)
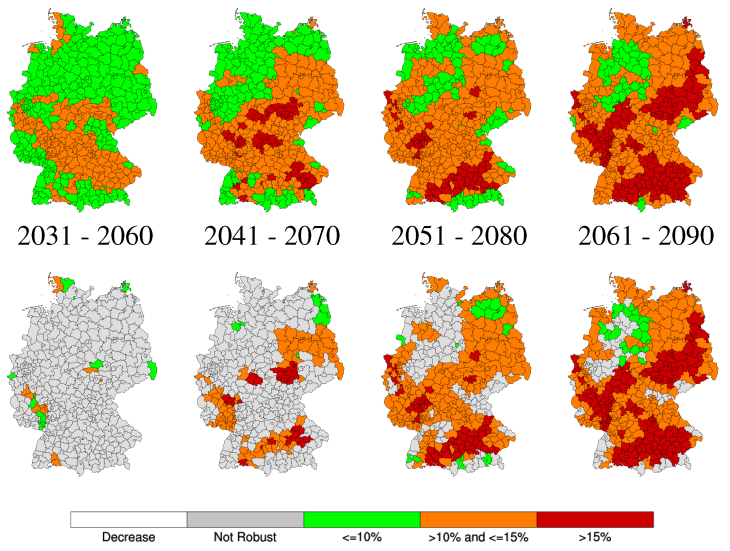
Figure 2. Increase of winter precipitation (%) for (from left to right) 2031–2060, 2041–2070, 2051–2080 and 2061–2090 compared to the reference period 1971–2000. Color coded: median of 11 RCM simulations from the EURO-CORDEX RCP8.5 simulations. For the top panels, no test was applied to the data. In the lower panels, regions that failed at least one of the two robustness tests are grayed out.
Increase of winter precipitation (ENSEMBLES A1B)
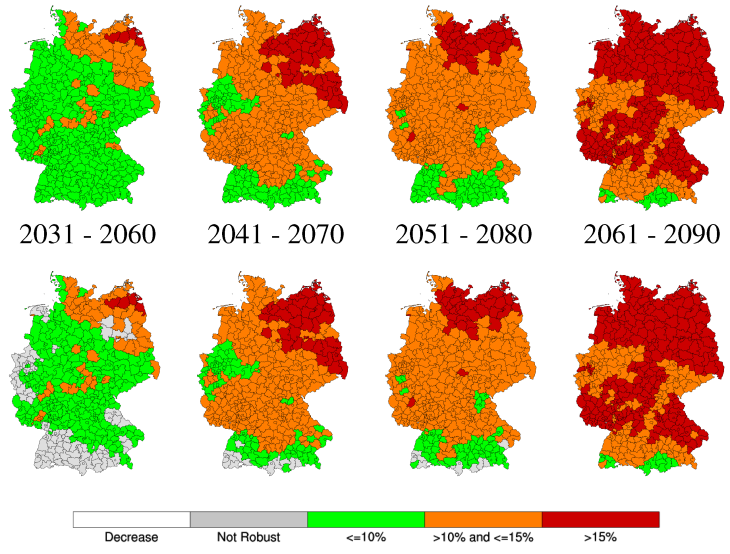
Figure 3. Increase of winter precipitation (%) for (from left to right) 2031–2060, 2041–2070, 2051–2080 and 2061–2090 compared to the reference period 1971–2000. Color coded: median of 15 RCM simulations from the ENSEMBLES A1B simulations. For the top panels, no test was applied to the data. In the lower panels, regions that failed at least one of the two robustness tests are grayed out.
Decrease of summer precipitation (RCP4.5)
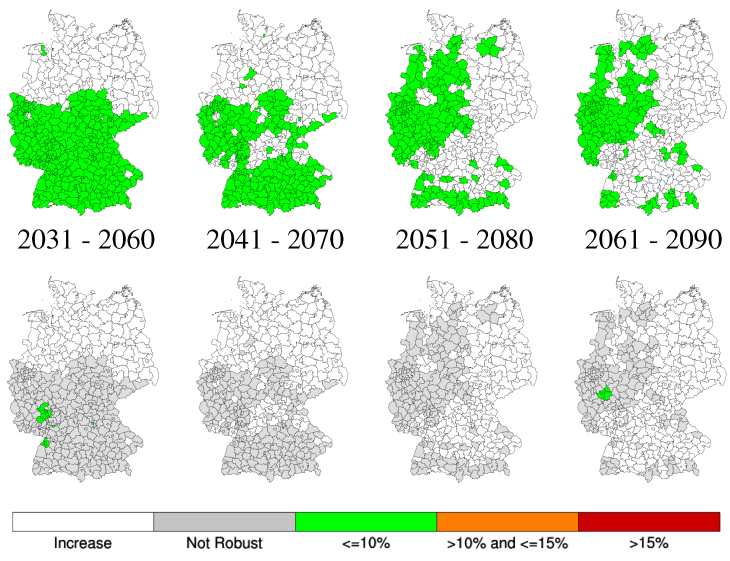
Figure 4. Decrease of summer precipitation (%) for (from left to right) 2031–2060, 2041–2070, 2051–2080 and 2061–2090 compared to the reference period 1971–2000. Color coded: median of 10 RCM simulations from the EURO-CORDEX RCP4.5 simulations. For the top panels, no test was applied to the data. In the lower panels, regions that failed at least one of the two robustness tests are grayed out.
Decrease of summer precipitation (RCP8.5)
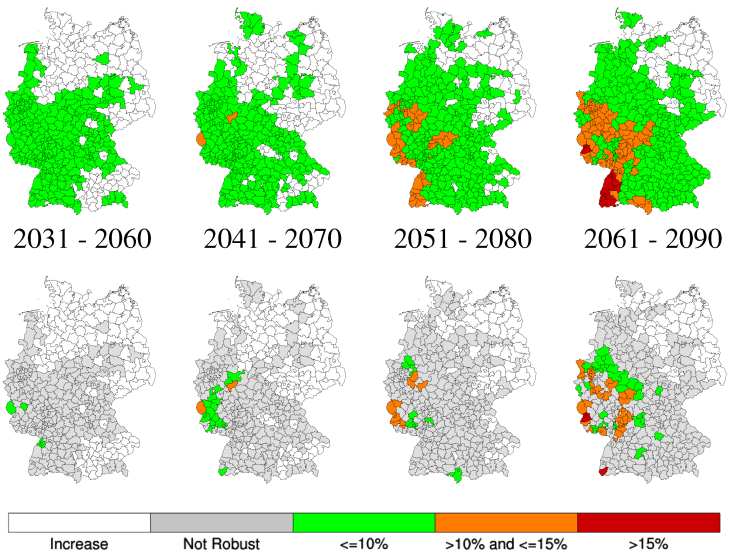
Figure 5. Decrease of summer precipitation (%) for (from left to right) 2031–2060, 2041–2070, 2051–2080 and 2061–2090 compared to the reference period 1971–2000. Color coded: median of 11 RCM simulations from the EURO-CORDEX RCP8.5 simulations. For the top panels, no test was applied to the data. In the lower panels, regions that failed at least one of the two robustness tests are grayed out.
Decrease of summer precipitation (ENSEMBLES A1B)
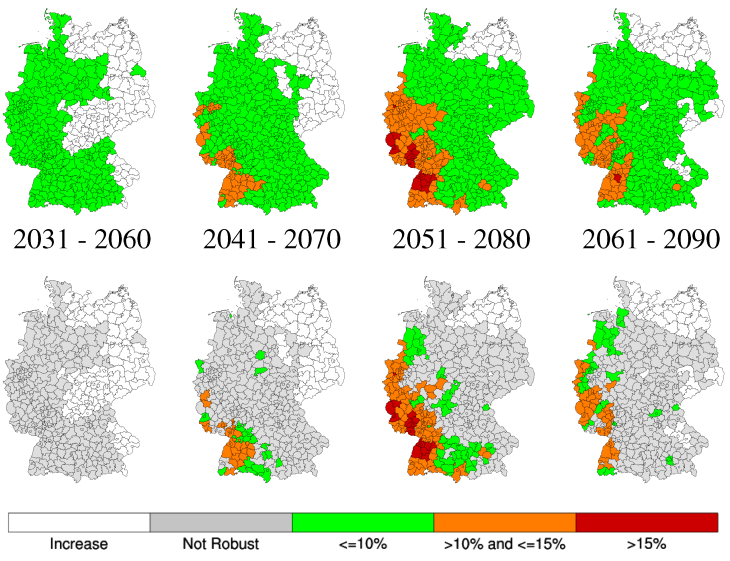
Figure 6. Decrease of summer precipitation (%) for (from left to right) 2031–2060, 2041–2070, 2051–2080 and 2061–2090 compared to the reference period 1971–2000. Color coded: median of 15 RCM simulations from the ENSEMBLES A1B simulations. For the top panels, no test was applied to the data. In the lower panels, regions that failed at least one of the two robustness tests are grayed out.
Increase of the number of winter days exceeding today’s 95th percentile of daily winter precipitation (RCP4.5)
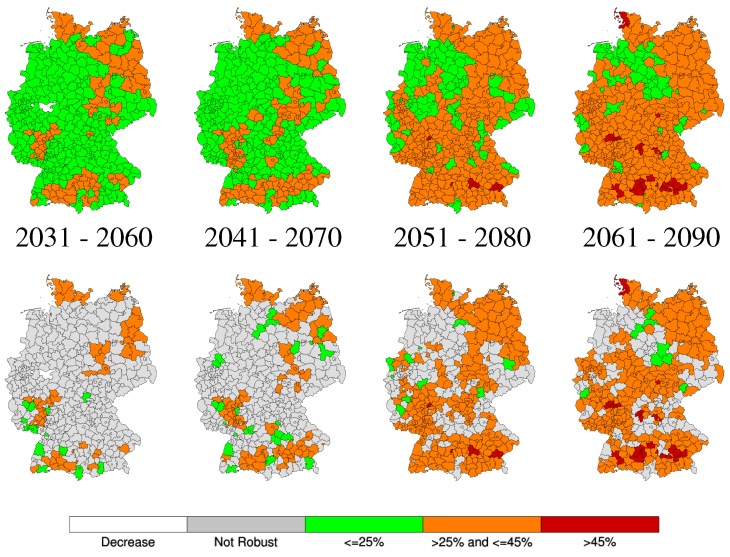
Figure 7. Increase of the number of winter days exceeding today’s 95th percentile of daily winter precipitation (%) for (from left to right) 2031–2060, 2041–2070, 2051–2080 and 2061–2090 compared to the reference period 1971–2000. Color coded: median of 10 RCM simulations from the EURO-CORDEX RCP4.5 simulations. For the top panels, no test was applied to the data. In the lower panels, regions that failed at least one of the two robustness tests are grayed out.
Increase of the number of winter days exceeding today’s 95th percentile of daily winter precipitation (RCP8.5)
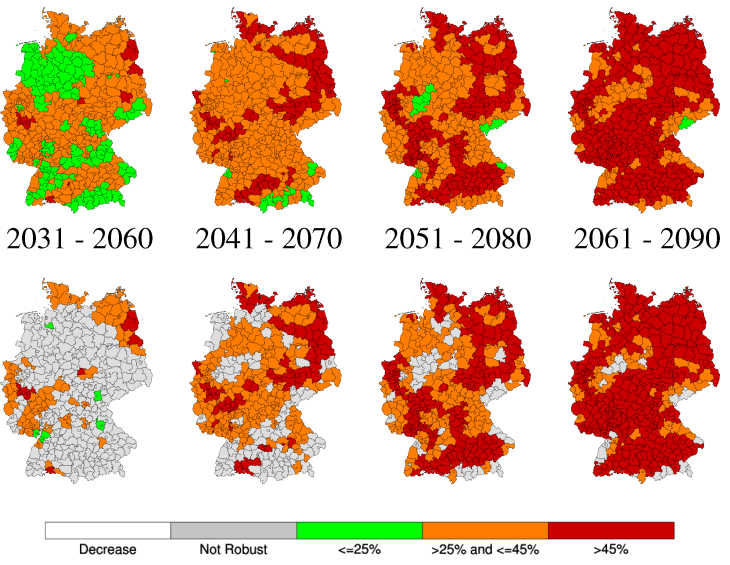
Figure 8. Increase of the number of winter days exceeding today’s 95th percentile of daily winter precipitation (%) for (from left to right) 2031–2060, 2041–2070, 2051–2080 and 2061–2090 compared to the reference period 1971–2000. Color coded: median of 11 RCM simulations from the EURO-CORDEX RCP8.5 simulations. For the top panels, no test was applied to the data. In the lower panels, regions that failed at least one of the two robustness tests are grayed out.
Examples for thematic Climate Signal Maps
Increase of the number of winter days exceeding today’s 95th percentile of daily winter precipitation (ENSEMBLES A1B)
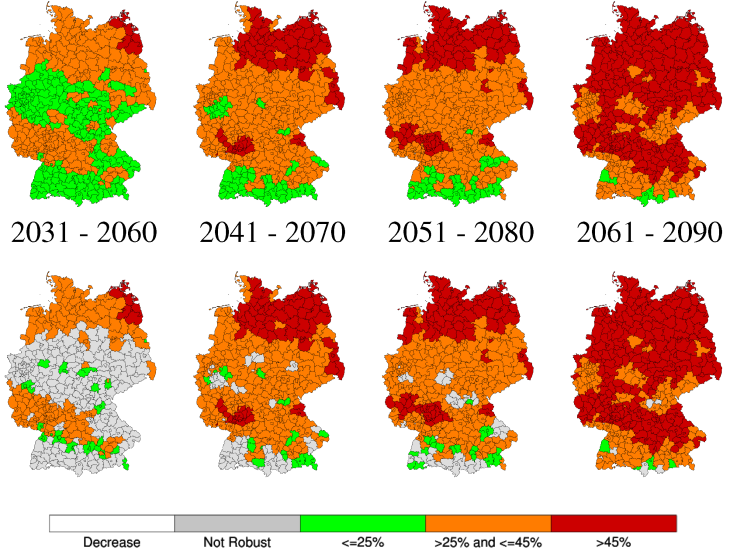
Figure 9. Increase of the number of winter days exceeding today’s 95th percentile of daily winter precipitation (%) for (from left to right) 2031–2060, 2041–2070, 2051–2080 and 2061–2090 compared to the reference period 1971–2000. Color coded: median of 15 RCM simulations from the ENSEMBLES A1B simulations. For the top panels, no test was applied to the data. In the lower panels, regions that failed at least one of the two robustness tests are grayed out.
